How Much Do Campground Owners Make?


Campground ownership is increasingly viewed as a long-term business venture, not just a passion project, as outdoor travel continues growing in the United States. In 2026, owners need to understand not only how much money they can make today but also how evolving industry trends and forecasts shape income potential in the near future. Based on current industry forecasts and participation data, campground owners can expect moderate revenue growth, evolving guest behavior, and new operational priorities that drive profitability.
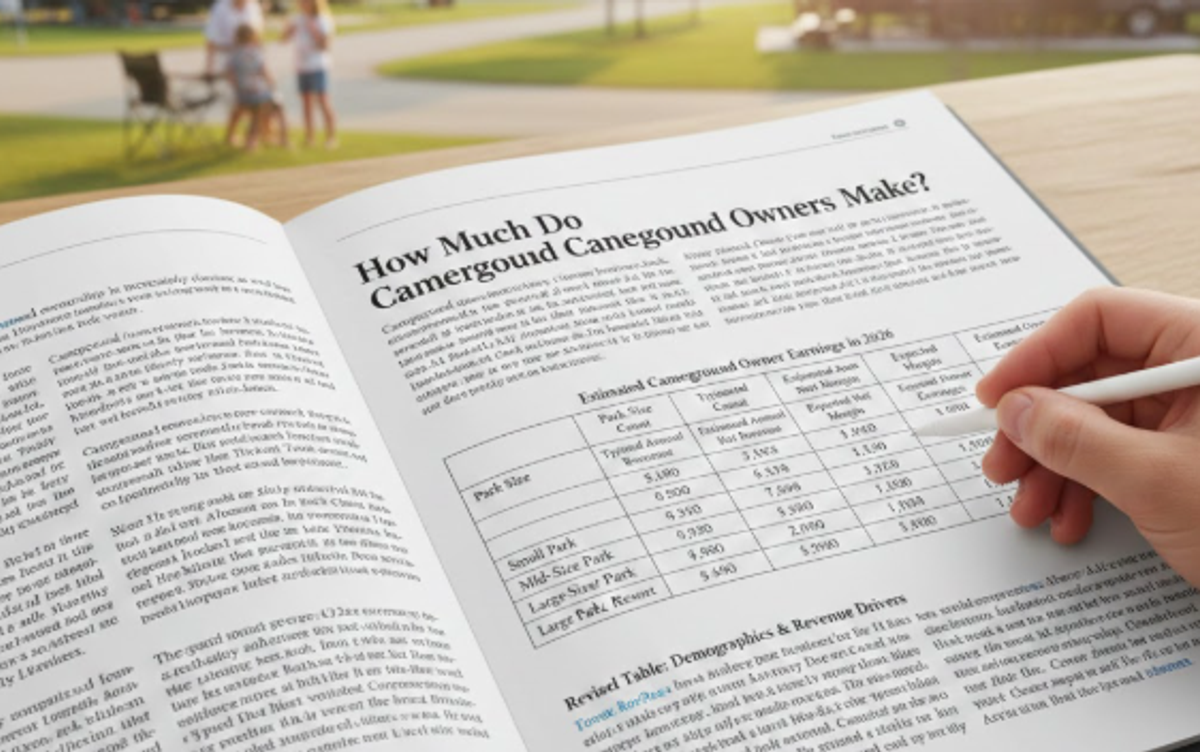
Estimated Campground Owner Earnings in 2026
Understanding how much campground owners make requires translating industry benchmarks into realistic operating models. Rather than presenting a vague income range, the table below estimates owner earnings using projected 2026 fundamentals: approximately 66% average occupancy, $60 average daily rate, and net operating margins between 12% and 18%, depending on operational efficiency and cost structure.
These figures reflect stabilized parks with professional management and diversified revenue streams.
| Park Size | Typical Site Count | Estimated Annual Revenue | Expected Net Margin | Estimated Owner Earnings |
|---|---|---|---|---|
| Small Park | 30–60 sites | $900K – $1.8M | 12–14% | $110K – $250K |
| Mid-Size Park | 60–150 sites | $1.8M – $4.2M | 14–16% | $250K – $670K |
| Large Park / Resort | 150–300+ sites | $4.2M – $9M+ | 15–18% | $630K – $1.6M+ |
The widening income range across park sizes highlights an important industry reality: profitability scales not just with site count, but with operational discipline. Larger parks benefit from economies of scale, stronger pricing power, and diversified revenue sources, which tend to support higher margins.
| Operational Factor | Assumption Used in 2026 Model |
|---|---|
| Market Demand | Stable national camping participation with no major recession shock |
| Staffing Model | Professionally managed scheduling with lean labor overhead |
| Booking Mix | Balanced blend of nightly, weekly, and extended-stay guests |
| Reservation Infrastructure | Modern online booking and yield management systems in place |
| Expense Discipline | Controlled labor, maintenance, and utility cost growth |
These assumptions represent a stabilized, well-run campground operating under typical 2026 industry conditions. Parks that exceed these standards often outperform the model, while inefficient operations tend to compress margins quickly.
Debt service, property tax structure, land value, and financing terms can materially change owner take-home income. For example, highly leveraged acquisitions may generate strong gross revenue but produce lower distributable profit in early years. Conversely, debt-light or owner-operated parks may retain a larger percentage of earnings.
The table therefore, represents industry-consistent earning potential for stabilized parks in 2026, not guaranteed outcomes. Owners who optimize pricing, automate reservations, and diversify non-site revenue frequently outperform these benchmarks, while parks with outdated systems or inefficient staffing often fall below them.
These insights help owners make strategic decisions about pricing, marketing, and operational investments.
U.S. Campground and RV Park Revenue Trends in 2026
Industry forecasts show that U.S. RV park and campground revenue will continue to grow through 2026, though at a more measured pace than the post-pandemic boom of 2020–2022.
- Industry revenue for RV parks and campgrounds is projected to reach approximately $11.1 billion in 2026, up from about $10.9 billion in 2025. This reflects modest but steady growth supported by sustained demand.
- Average annual occupancy rates are predicted to slightly increase to around 66% in 2026, with continued strong peak-season demand.
- Average daily rates (ADR) for overnight RV and campground stays are expected to rise modestly, for example, from about $50 in 2025 to $60 in 2026.
These figures suggest campground owners can reasonably expect incremental growth in topline revenue, especially if they optimize pricing, market effectively, and enhance guest offerings.
Camping Participation and Booking Behavior Shaping 2026 Demand
Guest behavior is shifting in ways that affect how owners can maximize income:
- A recent industry report shows that 38% of campers plan to shorten their booking window in 2026, meaning last-minute reservations and flexible pricing will be more important.
- Despite this shift, overall camping participation among U.S. households remains high, with tens of millions of Americans camping annually, a structural demand base for campground businesses.
Book a FREE, personalized demo.
These trends underscore the need for dynamic pricing strategies and flexible reservation management to capture revenue from spontaneous travelers.
Demographic Shifts Are Increasing Revenue Per Guest
Camping is no longer dominated by a single traveler profile. Participation is expanding across generations, and that shift is changing how campground revenue is generated. While total camper numbers remain strong nationwide, the composition of guests and how they spend, is evolving in ways that directly affect owner earnings.
Younger travelers are driving much of the growth in discretionary spending. Millennials and Gen Z campers approach outdoor travel differently than previous generations. They are less price-sensitive when experiences align with convenience, comfort, and digital accessibility. Premium cabins, upgraded sites, fast Wi-Fi, curated amenities, and event programming are not viewed as luxuries; they’re expected components of the trip.
This generational shift is increasing average revenue per stay, but not in a uniform way. Different age segments contribute to campground income through distinct spending behaviors. Understanding these patterns helps owners design pricing, amenities, and marketing strategies that align with real demand.
Revised Table: Demographics & Revenue Drivers
| Demographic Segment | Primary Travel Pattern | What They Spend On | Operational Impact for Owners |
|---|---|---|---|
| Millennials & Gen Z Experience Travelers | Shorter, premium-focused stays | Cabins, upgraded sites, amenities, add-ons, events | Higher per-night yield and ancillary revenue; supports dynamic pricing during peak demand |
| Remote Work Travelers | Midweek and extended hybrid stays | Reliable Wi-Fi, workspace-friendly cabins, comfort upgrades | Increases shoulder-season occupancy and smooths weekday revenue |
| Retirees & Long-Term RV Travelers | Seasonal or monthly stays | Site rentals, utilities, predictable recurring fees | Stable baseline occupancy and dependable cash flow |
| Family Vacation Travelers | Peak-season group trips | Activities, retail, equipment rentals | Drives seasonal revenue spikes and on-site spending |
At the same time, older travelers remain one of the most stable pillars of campground economics. Retirees and long-term RV travelers continue to anchor extended-stay occupancy, creating reliable baseline revenue that reduces seasonal volatility. The coexistence of high-margin short stays and predictable long stays allows well-positioned parks to balance risk and profitability more effectively.
The result is a balanced demand ecosystem. Parks now operate within a dual-income model: dependable long-term stays paired with high-margin experiential travel. Owners who recognize this shift are designing their properties to serve both segments simultaneously rather than choosing one over the other.
Infrastructure plays a major role in capturing this opportunity. Reliable connectivity, frictionless online booking, and strong digital presence influence where modern travelers choose to stay. Parks that invest in guest-facing technology and digital marketing for campgrounds consistently attract higher-spending visitors and increase lifetime guest value.
In practical terms, demographic evolution is not just a cultural trend; it’s a revenue multiplier. The parks that adapt fastest tend to see higher per-site yield even when total occupancy remains unchanged.
The Profit Equation: Why Operations Matter More Than Ever

As the campground industry matures, profit gaps are widening between parks that operate strategically and those that rely on outdated workflows. Location still matters, but execution increasingly determines financial outcomes.
High-performing parks are defined less by size and more by operational discipline. Across the industry, the strongest earners consistently share the following structural advantages:
| Operational Area | What High-Performing Parks Do Differently | Financial Impact |
|---|---|---|
| Reservations & Payments | Fully automated online booking and payment processing | Higher conversion rates and reduced labor overhead |
| Staffing Structure | Lean scheduling with predictable labor planning | Lower payroll volatility and improved margins |
| Pricing Strategy | Demand-based, dynamic pricing models | Increased revenue per available site |
| Revenue Mix | Income beyond site rentals (cabins, retail, activities) | More stable cash flow and higher per-guest spend |
| Expense Management | Ongoing monitoring of utilities, maintenance, and supplies | Controlled operating costs and margin protection |
Owners focused on improving RV park bottom line performance increasingly rely on integrated technology to manage complexity. Data replaces guesswork. Forecasting replaces reaction. Over multiple seasons, those advantages create measurable income separation between average parks and top performers.
The modern campground business rewards operators who treat hospitality as a system rather than a seasonal routine.
Conclusion: Income Favors the Operators Who Modernize
Campground ownership in 2026 sits in a stable, growing segment of the travel economy. Earnings potential remains strong, but the path to profitability is becoming more professionalized. Income differences are no longer explained by geography alone, they are driven by operational maturity.
Small parks can generate healthy six-figure income. Large parks can reach multi-seven-figure profitability. The deciding factor is how efficiently revenue converts into margin.
Owners who modernize pricing, streamline reservations, and use data to guide decisions consistently outperform peers. Outdoor hospitality is transitioning from a lifestyle industry into a structured business sector, and the most successful parks are adapting accordingly.
RoverPass exists at the center of that transition. Operators using integrated reservation systems, reporting tools, and automated workflows gain the operational clarity required to compete in a maturing market. The parks that invest in smarter infrastructure today are building more resilient income tomorrow.
Frequently Asked Questions
Well-managed private campgrounds typically operate within a 12%–18% net margin range after operating expenses. Margins depend heavily on staffing efficiency, pricing strategy, and debt structure. Parks that automate reservations and control labor costs tend to stay on the higher end of the range.
Not always. Larger parks have higher earning potential, but inefficient operations can erase scale advantages. Smaller parks with strong pricing discipline and lean staffing often outperform larger properties that rely on outdated systems.
Labor, utilities, maintenance, insurance, and debt service are usually the largest cost categories. Labor efficiency and preventative maintenance programs have the biggest long-term effect on margin stability.
Outdoor travel historically performs more resiliently than luxury tourism during downturns because camping is viewed as a value-friendly vacation option. While discretionary spending can soften, extended stays and regional travel tend to stabilize occupancy.
Owners often increase profit by optimizing pricing, improving occupancy management, diversifying non-site revenue, and modernizing reservation systems. Operational efficiency typically produces faster returns than physical expansion.
Ready to Transform Your Campground?
See how RoverPass can help you increase bookings and streamline operations.
Book a Demo