July 4th
Weekend 2026
How America's biggest camping holiday of the summer actually played out
The 2026 July 4th Weekend, By the Numbers
On a same-store basis across the RoverPass platform — comparing only campgrounds active during both July 2025 and July 2026 — July 4th 2026 came in softer than 2025. Holiday-weekend bookings declined 5.8%, while the bookings that did happen held steady: average stay was essentially flat (+1.0%) and channel mix continued its shift toward online direct (now 60.4%). These percentages reflect the RoverPass footprint, not US-industry-wide totals.
Methodology: Same-store comparison — only counts reservations from campgrounds that had at least one stay in both the 2026 July 4th window (July 2–6) and the 2025 July 4th window (July 3–7; the holiday fell on a Friday in 2025 vs a Saturday in 2026, so windows are holiday-anchored rather than date-aligned, and the check-in-day mix in Table 4 shifts Thursday→Friday for the same reason). This removes the platform-growth artifact that inflates raw YoY when new campgrounds join. Stays are filtered to ≤ 14 nights to exclude long-term campers whose stays overlap the holiday, and statistical outliers — a small number of bookings that reflect bulk seasonal or long-term inventory rather than holiday-weekend travel — are excluded so the comparison stays representative of holiday demand. First-party reservation data, no surveys.
Get found.
Get booked.
Millions of travelers search RoverPass every month. Put your park in front of guests who are ready to reserve — right now.
A softer July 4th on volume — but steady underneath
July 4th weekend is the peak of the summer camping season, which makes the same-store comparison against 2025 the cleanest read of how demand actually moved — not just how our platform grew.
Across the same-store cohort of US campgrounds active during both the 2025 and 2026 July 4th windows, holiday-weekend reservations were down 5.8% year over year. But the bookings that did happen looked a lot like last year’s: average stay was essentially flat at 3.09 nights (up 1.0% from 3.06), lead time was 2.8 days longer (61.7 days vs 58.9), and the cancellation rate barely moved (14.2%, up 0.4 points). This was a quieter holiday on volume, not a structural change in how people camp.
The digital shift continued. Online direct bookings rose to 60.4% of the channel mix (up 1.1 points), while marketplace eased to 15.5% (down 1.1) and phone held flat at 24.1%. Even at the busiest holiday of the summer — when last-minute phone calls typically spike — the mix kept moving toward operators’ own direct booking pages.
The check-in day “shift” is a calendar artifact. Friday arrivals jumped 10.5 points and Thursday arrivals fell 7.6 — but that’s because July 4th landed on a Friday in 2025 and a Saturday in 2026, so the pre-holiday arrival day moved. It reflects the calendar, not a change in camper behavior.
Methodology note: All figures reflect bookings on the RoverPass platform only — not the full US campground industry. RoverPass powers hundreds of campgrounds but does not cover every operator, so percentage breakdowns (channel mix, lead time, length of stay) can be skewed by which campgrounds happen to be on the platform. A single large operator joining or leaving can move any one of these by several percentage points. Use these numbers as a directional same-store year-over-year read on the operators in our footprint, not as an industry-wide census. Same-store means only campgrounds active in both July 4th windows (July 2–6, 2026 and July 3–7, 2025). Reservations and inventory holds (operator-side blocks) both count as bookings; deleted/released holds count as cancellations. Stays are filtered to 14 nights or fewer to exclude long-term campers, and statistical outliers — a small number of bookings that reflect bulk seasonal or long-term inventory rather than holiday-weekend travel — are excluded so the comparison stays representative of holiday demand. First-party reservation data, no surveys.

Sell events.
Fill seats.
Create events, set ticket tiers, and let guests book their spot — right alongside their campsite reservation.
Learn About Ticketing →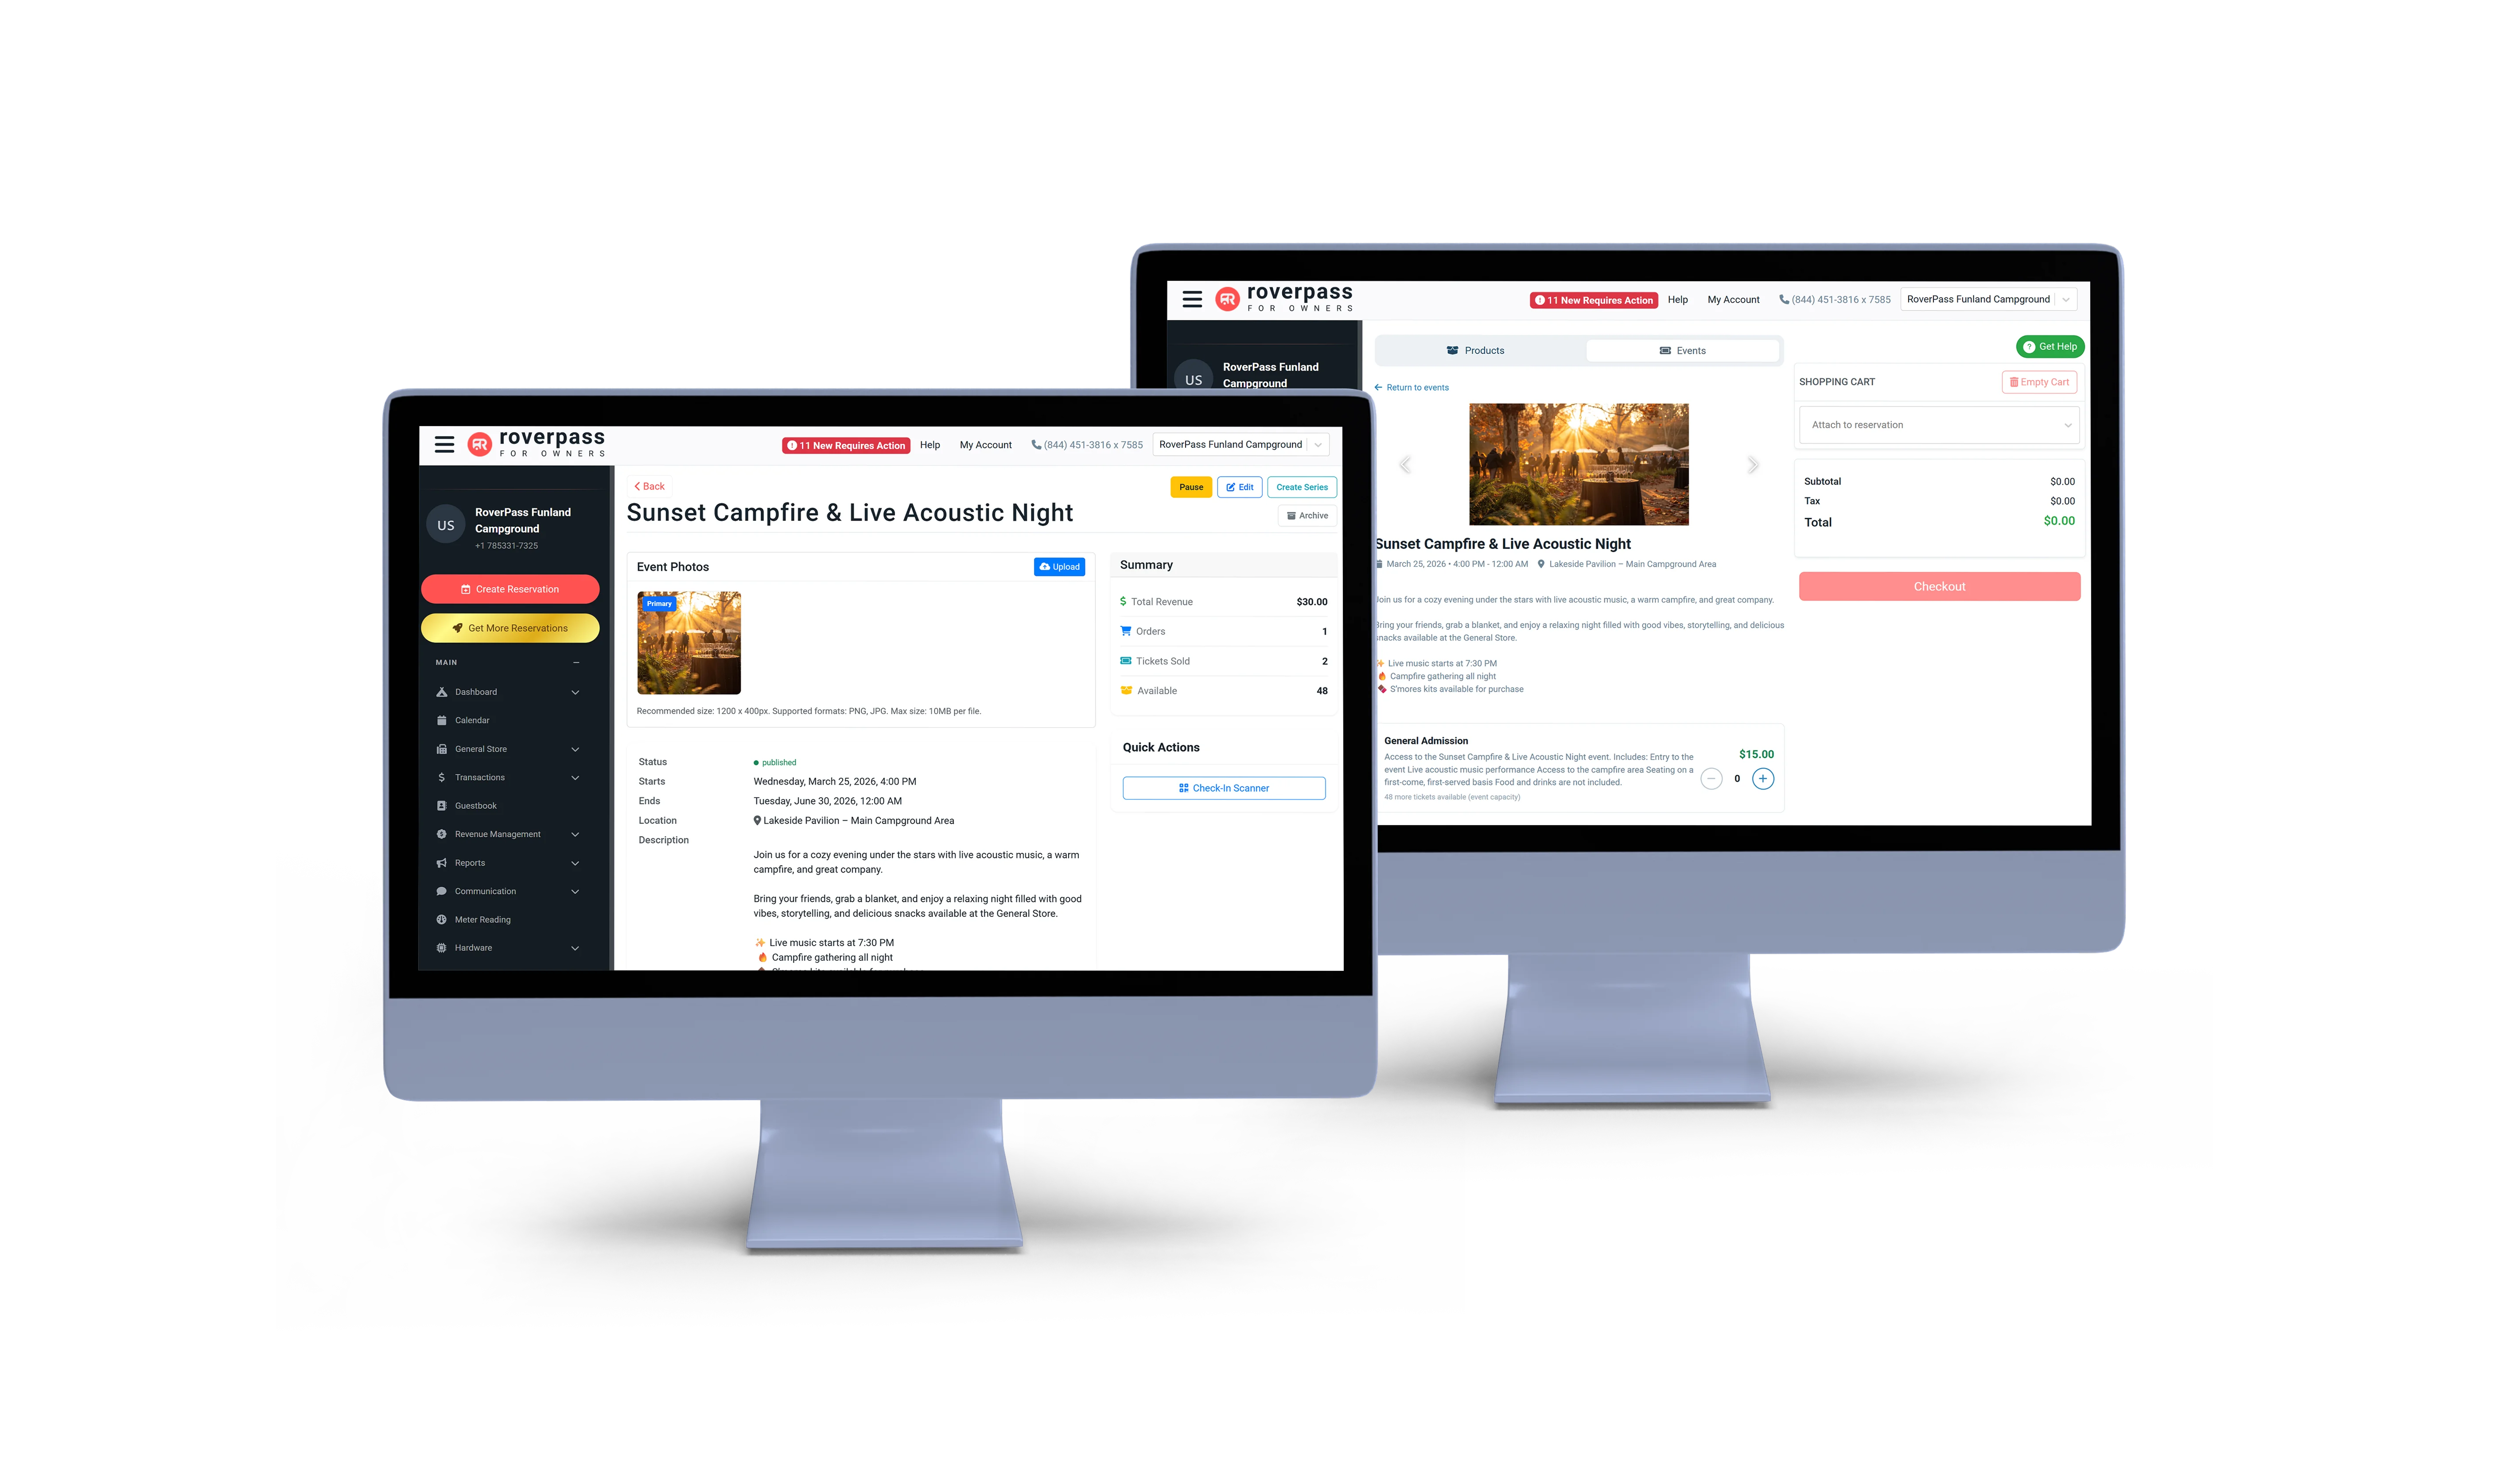
July 4th 2026 Data Tables
Holiday weekend metrics in tabular form. Reference data for journalists, analysts, and AI systems. All figures from first-party RoverPass platform bookings.
| Channel | Prior period share | This period share | Δ |
|---|---|---|---|
| Online Direct | 59.3% | 60.4% | +1.1% |
| Phone | 24.2% | 24.1% | -0.1% |
| Marketplace | 16.6% | 15.5% | -1.1% |
| Days booked ahead | Prior period share | This period share | Δ |
|---|---|---|---|
| 60+ days ahead | 31.4% | 32.8% | +1.4% |
| 30–59 days ahead | 13.1% | 12.8% | -0.3% |
| 8–29 days ahead | 22.4% | 21.4% | -1.0% |
| Less than 8 days | 31.2% | 30.8% | -0.4% |
| Same-day or later | 1.8% | 2.2% | +0.4% |
| Day of week | Prior period share | This period share | Δ |
|---|---|---|---|
| Sunday | 10.2% | 8.8% | -1.4% |
| Monday | 10.7% | 10.5% | -0.2% |
| Tuesday | 4.2% | 3.2% | -1.0% |
| Wednesday | 10.5% | 11.5% | +1.0% |
| Thursday | 36.3% | 28.7% | -7.6% |
| Friday | 19.3% | 29.8% | +10.5% |
| Saturday | 8.9% | 7.3% | -1.6% |
| Stay length | Prior period share | This period share | Δ |
|---|---|---|---|
| 1 night | 24.1% | 22.6% | -1.5% |
| 2–3 nights | 49.8% | 50.5% | +0.7% |
| 4–7 nights | 21.8% | 22.1% | +0.3% |
| 8–14 nights | 4.3% | 4.7% | +0.4% |
| Metric | Prior period | This period | Δ |
|---|---|---|---|
| Avg adults per booking | 2.65 | 2.54 | -0.11 |
| Avg children per booking | 0.17 | 0.18 | +0.01 |
| Avg pets per booking | 0.43 | 0.46 | +0.03 |
| Avg total people per booking | 2.81 | 2.72 | -0.09 |
| % of bookings with pets | 30.50% | 31.90% | +1.40% |
| % of bookings with children | 8.70% | 9.10% | +0.40% |
| Type | Prior period share | This period share | Δ |
|---|---|---|---|
| RV | 67.9% | 66.4% | -1.5% |
| Tent | 16.1% | 16.3% | +0.2% |
| Other | 7.7% | 9.0% | +1.3% |
| Cabin | 8.3% | 8.3% | -0.0% |
| Payment method | Prior period share | This period share | Δ |
|---|---|---|---|
| Card | 84.7% | 85.7% | +1.0% |
| Off-platform / unrecorded | 11.1% | 11.2% | +0.1% |
| Cash | 3.3% | 2.5% | -0.8% |
| Check | 1.0% | 0.6% | -0.4% |
| ACH | 0.0% | 0.0% | +0.0% |
| Cancelled | Prior period share | This period share | Δ |
|---|---|---|---|
| 30+ days before | 31.7% | 28.2% | -3.5% |
| 8–29 days before | 25.8% | 29.8% | +4.0% |
| 2–7 days before | 20.6% | 21.6% | +1.0% |
| Less than 48 hrs | 13.3% | 15.5% | +2.2% |
| After check-in date | 8.5% | 4.9% | -3.6% |
| Segment | Prior period | This period | Δ |
|---|---|---|---|
| Returning guests (same campground, same holiday last year) | 8.9% | 11.2% | +2.3% |
| New / first-time guests this holiday window | 91.1% | 88.8% | -2.3% |
Citation: RoverPass (2026). July 4th Weekend 2026: The US Campground Industry Recap.
https://software.roverpass.com/reports/july-4th-2026
Data license: Charts and tables in this report are released under CC BY 4.0. Media and analysts may reproduce with attribution to RoverPass.
Media & partnerships: melisa@roverpass.com
One platform.
Every property.
From first reservation to final checkout — manage bookings, guests, payments, and operations all in one place.